One of the more exciting elements of the Viral Sign platform is the ability to secure meaningful insights into the transmission of infectious diseases, including COVID-19 and influenza. As we go forward, the trends and patterns in the Viral Sign data set will be quite revealing, both at the macro and micro (client) level.
At the macro level, it will be interesting to analyze the results from Viral Sign screening activity relative to the known or predicted incidence of influenza-like illness (ILI) in a region or community. Similarly, at the client level, longitudinal data specific to the variances in the number and percentage of screening results will continue to motivate desired behaviors at the organization and individual (employee) level.
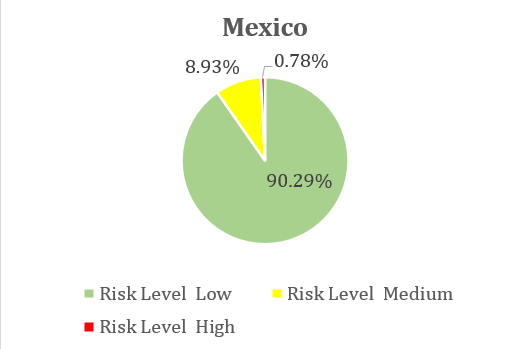
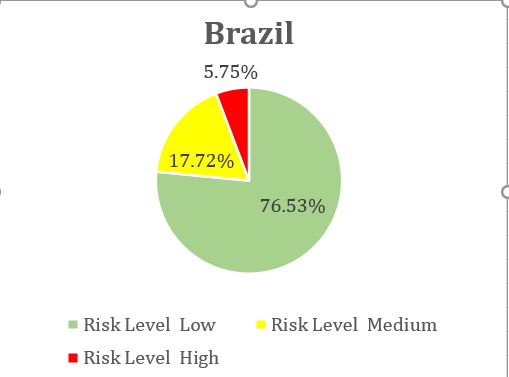
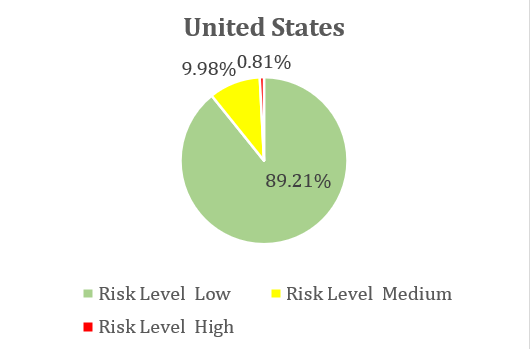
In the attached charts, we can see identify similarities and disparities in the Viral Sign screening data for the United States, Mexico, and Brazil for the month of July. The total number of screens in the data set exceeds 200,000, with each country contributing at least 20,000 screens. This data was presented by Dr. Marcos Brioschi at the American Academy of Thermology meeting (held online) on September 12, 2020.
–
- During July, Brazil, and particularly Sao Paulo, experienced a very high incidence of COVID-19. The high incidence of COVID-19 produced a relatively high percentage of medium and high risk screening results (23.5%) compared to the United States and Mexico, where the combined total was less than 11%.
- In all countries, there was a much larger segment of the screened population assigned to the medium risk category than the high risk category. The medium risk category represents individuals who are without fever, but who are characterized as presymptomatic due to the thermal signature indicative of a presymptomatic state found in the individual’s face.
- The difference in the number and percentage of the medium risk category and the high risk category is what we refer to as the “Viral Sign gap”. These are the individuals who the Viral Sign algorithm has identified as highly suspicious for carrying an influenza-like illness, but who are not yet expressing a fever. For this population, a simple temperature assessment using a point temperature could result in a false negative, or someone who is a carrier of the virus but is not yet in a fever state.
- The Viral Sign data set worldwide includes over 750,000 screening events and the data indicates that the percentage of individuals with fever who are screened is most often in the 1-2% range, similar to the results seen in Mexico and United States. This suggest that the Viral Sign gap will remain significant into and through the fall period as the U.S. enters a time of year when the incidence of flu increases.
We look forward to bringing “Viral Sign by the Numbers” to you on a regular basis. Please check back with us often for macro and micro level insights emerging from the Viral Sign data set.